STRAIN COMPASS INSIGHTS
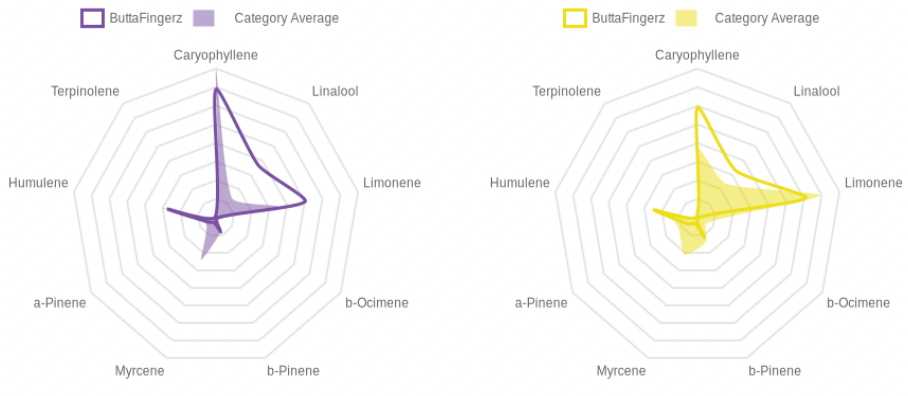
The Strain Compass becomes really powerful when utilized to compare the category shape to the shape a product makes on the same radar chart. This not only shows the product in a category, but also clearly highlights the unique chemical profile of that particular product when compared to the average.

Products with similar chemical profiles will be placed in the same category, as they are located close to one-another in the Strain Category Universe. However, each product will be slightly different than the average for that category, showcasing its unique composition.

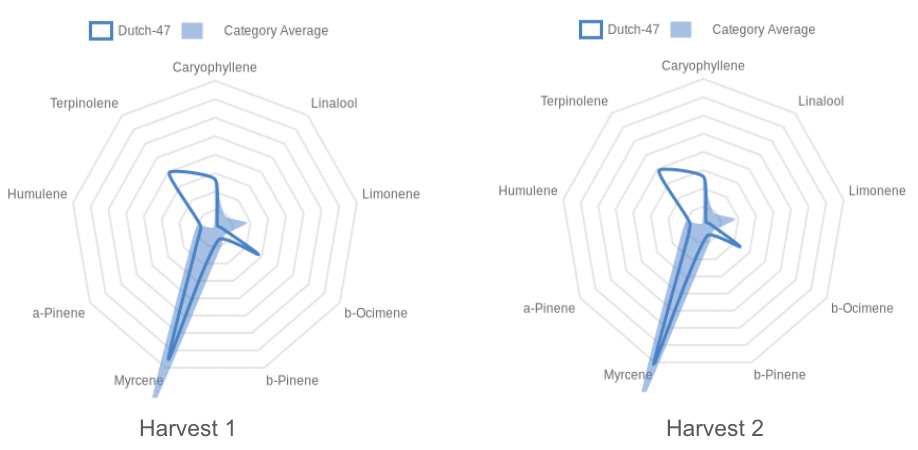
Additionally, the Strain Compass provides a thumbprint of the product that can be compared to itself over time. Showing how much variation is occurring between batches. In the below example, Harvest 1 has less Myrcene and more b-Ocimene than Harvest 2, although the difference is slight, indicating high consistency from batch to batch.

This type of variation can, in some cases, show the product switching categories between harvests if it resides on the edge between two categories.

